
By Karl Chapman, CEO, Kim Document.
Personal Happiness?
Mo Gawdat, formerly at Google X and author of ‘Solve for Happy’, created his own equation for happiness:
‘Happiness is equal to or greater than the events of your life,
minus your expectation of how life should be.’
Meanwhile, psychologist Martin Seligman’s formula is: Happiness (H) is the sum of three factors: one’s genetic happiness set range (S), factors under one’s voluntary control (V), and life circumstances (C). In the Seligman model S = 50%, V = 40%, and C = 10%:
H=S+C+V
Plus, University College London neuroscientists have also calculated a mathematical formula for happiness:
(t)=w0+w1∑j=1tγt−jCRj+w2∑j=1tγt−jEVj+w3∑j=1tγt−jRPEj
Essentially this means: lower your expectations, but not so far that it leaves you miserable. Do this, and you will achieve optimum happiness.
Technology Happiness?
This got us thinking. What is the technology happiness formula? Surely, we can create one.
Having discussed this with a range of people in different roles (from IT and InfoSec to innovation managers and end users), we came up with the equation below. Where ‘ts’ is Table Stakes, ‘mlp’ is Minimum Lovable Product, ‘roi’ is Return on Investment, and ‘H’ (you guessed it) equals happiness.
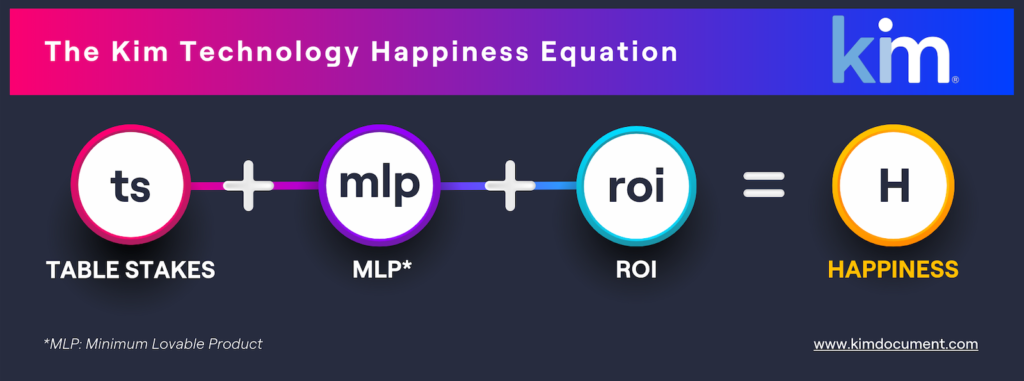
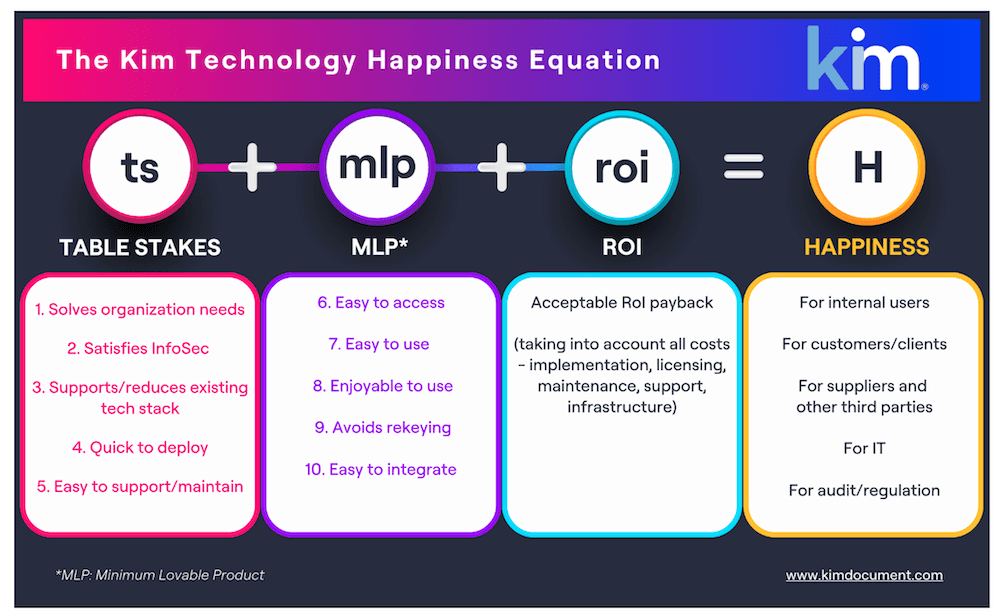
The diagram below explains this further, but in simple terms, none of these elements, on their own, are sufficient to deliver technology happiness. It does not matter how intuitive the product is or what the forecast RoI is, if the product fails to pass the ‘table stakes’ tests (InfoSec, fits tech stack, quick to deploy, etc.), it will not get out of the gate. Equally, if the product passes the ‘table stakes’ test and it has a potentially high RoI, this is of little value if no one will use it. It is the combination of all three that delivers technology happiness. In reviewing the below, please note that there are details explaining the requirements of each of the 1-10 items in the first two categories, but space prevents these from being presented here.
As to the relative weightings between these categories, discussions led us to conclude, and this is different from our starting view where we had a higher percentage for Return on Investment (roi), that it is something like:
- ts = 40%
- mlp = 50%
- roi = 10%
Help, please – The Kim Technology Happiness Equation v2?
You will have read the above and probably exclaimed, ‘but what about x or y’? We think the three categories are right (ts+mlp+roi) but are confident that the tests/content in each category can be tightened and/or expanded.
So, in the spirit of industry-wide collaboration, please send any thoughts you have to hello@kimdocument.com, and we will review contributions and issue an updated v2, with acknowledgments, in Q1 2023.
Kim Document versus The Technology Happiness Equation v1
Having settled on a v1 equation, we had to test our Business and Enterprise solutions against these categories. Pleasingly, we scored well in each section (which is supported by the response of customers). For example, more than 1 in 3 prospects who have a demo of Kim Document buy it. The Kim Document comparison against the v1 equation is all ticks:
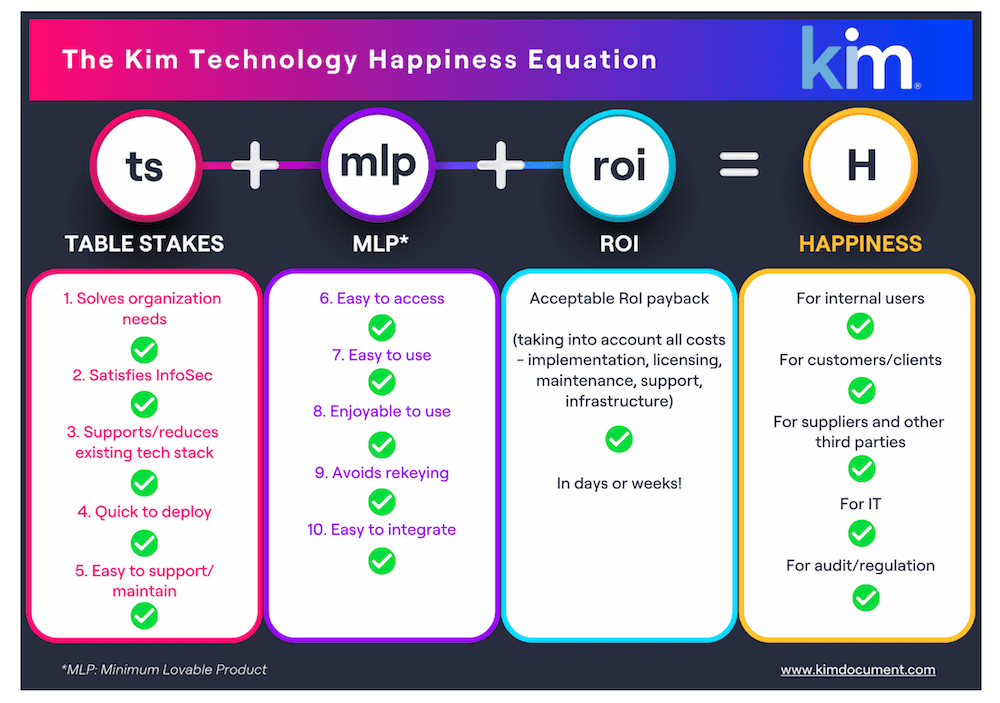
With more than 1 in 3 who see Kim in action buying it, seeing is believing. So Get in touch to book a demo tailored to your needs.
—
[ Artificial Lawyer is proud to bring you this sponsored thought leadership article by Kim Document. ]
Discover more from Artificial Lawyer
Subscribe to get the latest posts sent to your email.