
By Lilian Caldeira, co-founder, and Olga Mack, CEO, at Parley Pro
Introduction: Telling stories with data
Data on its own isn’t meaningful. We must interpret how the data applies in our specific context.
Stories play an essential role in the human reasoning processes. We use stories to explain and convince, and to connect with others. When you create and share impactful data stories, you command attention and engage in more meaningful conversations with your executive teams. Here, we describe how you can better use your data to tell stories.
Why tell data stories about contracts?
Collecting and analysing contract data is crucial to understanding your company’s past, present, and future outlook. Contract data includes:
- Data within your contracts (dates, dollar amounts, time periods, etc.),
- Data about how people and other software applications interact with your contracts,
- Data about how contracts perform over time.
Contract Lifecycle Management software (CLM) allows you to track and analyze these metrics. Over time, you can measure the effects of actions and determine what events triggered different results or reactions.
Ultimately, you’ll discover what decisions help your organisation reach its goals. You’ll also find out what activities negatively affect your company. This is the kind of information that helps companies become more successful.
Focus your story on the issues that matter most
Not all data or all stories are meaningful and leads to consequential insights.
Home in on the stories that help executives make decisions. Ask: If I share this story, will it help lead us to a successful result? Does it resolve a thorny issue? Will my audience be able to perform their jobs better after hearing this story? If so, then you know you’re crafting an informative data story that will provide guidance on important business concerns.
Data points: Where the action is!
Each date, party, time period, milestone, term, condition, and dollar amount in your CLM software is a data point. Each action that touches any contract, such as a review, and edit, or an e-signature, is a data point. So, too, is any activity monitored by CLM software, such as the status of contract or the completion of a task. Just a few of the many data points accessible to you through CLM software include:
- the total number of contract tasks (e.g., how many contracts need to be reviewed).
- the number of contracts expiring or renewing within the next 30 days.
- the number of contracts by the department, contract type, and contract status.
- many, many more!
You can even combine your CLM data points with additional data sources such as CRM software. Considered individually and as parts of an interacting whole, contract data points shape your story’s events. They function, interact, and change all the time. Each movement forms the genesis of a story. In other words, data points are where the action is! Once you understand what your story is about, visualisation tools help you show your audience how your story evolves.
Data visualisation: An intricate part of the storytelling process
‘You have to be creative about how you deliver the content and services that your internal clients need,’ says Julie Honor, General Counsel at 3QDigital. ‘You may need to sort through a massive amount of data, but the story you share with executives needs to be tailored to the business questions that your executives are trying to answer, and told in a visually streamlined and simple manner.’
Organising data is crucial to understanding it. Data visualisation techniques include displaying data in graphics such as tables, charts, plots and graphs. Analysts often perform exploratory data analytics to identify patterns and explore relationships.
Explanatory data analytics, on the other hand, help explain the why’s and how’s of various circumstances. In either case, visual representations of data make it easier to understand and share what you learn. But how do you ensure you create an impactful data story?
Tactics for creating an impactful data story
Telling impactful data stories requires that you show how the data addresses business challenges and answers executive questions. ‘Data storytelling is a rewarding approach for guiding our company leaders through key business decisions as well as sharing the effects of our legal efforts to company leaders,’ Julie Honor says. ‘All companies want to do more with less, and I can show them how we make that happen with data stories.’
You want the data stories you bring to the table to help decision-makers plan for the best course of action going forward. The following tactics show how to craft narratives that grab and hold attention and are clearly understood and easily remembered.
Tell stories about people
Make your story about people. ‘It’s difficult to assign meaning to a spreadsheet filled with numbers,’ Julie Honor says. ‘Listeners prefer stories about people over abstract arguments or statistics.’
Your stories become more accessible and memorable when they are about real people who must resolve the same conflicts, address the same issues, and face the same challenges as your listeners. Make your story about a person with a name, a face, and characteristics that your audience can relate to. They will be much more likely to care.
Make the ideas in your story ‘sticky‘
In the book ‘Made to Stick: Why Some Ideas Survive and Others Die‘, authors Chip and Dan Heath expound upon six fundamental principles that help make ideas memorable, i.e., ‘sticky’, including simplicity, unexpectedness, concreteness, credibility, emotions, and stories.
- Simplicity is focusing on one idea at a time.
- Unexpectedness refers to grabbing people’s attention by surprising them with unanticipated elements. Create curiosity gaps that hold listeners’ attention.
- Make ideas concrete by explaining them in terms of human actions.
- Credibility is enhanced when you find ways to let people test your ideas for themselves. (i.e., You may need to explain your analytical data procedures to show how you arrived at your conclusions.)
- Touch people’s emotions. Research shows that people are more likely to make a charitable gift to a single needy individual than to an entire impoverished community. (Another reason to make your story about a person experiencing everyday work life.)
- Hearing stories allow people to simulate the actions involved mentally. They become prepared to respond faster and more effectively.
Keep your story simple and maintain focus
CLM software allows you to drill down and analyze data at granular levels, which is often necessary to extract heavy-duty insights. When you can track so many different data points, it’s easy to go overboard. Track all you want. But when it comes to data storytelling, increase comprehension by sharing just one story at a time. The data stories you tell should be simple, with focused visuals to allow listeners to home in on one or two main points.
‘It’s tempting to overshare. You put so much hard work into the project!’ Julie Honor says. ‘But you must minimise extraneous details. Share stories that allow listeners to easily see what elements need to be addressed and by whom.’
Speak your audience’s language
Your audience probably won’t be full of data analysts. Avoid technical terms, including every day legal terms that are often unclear to your audience. At their core, data stories often discuss causes and effects related to specific actions. That is the high-level story you should share. Addressing statistical and data processing concepts can overwhelm your audience.
‘You must know your audience to craft an impactful data story. What are the most useful insights for their business concerns? How does the data relate to their lives?’ Julie Honor says. ‘The more you understand who your audience is, what they care about, and why they care, the easier you’ll transform data into stories that will impact them.’
Keep details in your back pocket
They aren’t the focus of your story, but you still must be able to answer any questions about your analytical processes. Make sure you have those details in your back pocket for fast reference.
Lead with the most important information first
Data stories don’t start like fiction novels with major exposition and back story. Ask yourself: ‘If I had to write one sentence that conveyed the most important idea, what is it?’ Or: ‘If my audience walks away knowing only one thing, what do I want that to be?’ Translate your answers into section headings and titles of the charts and visuals that show data.
Consider any ethical implications
We are only human. It’s natural to want to tell a highly compelling story. Still, we must avoid misleading listeners with data. Also, avoid making assumptions. Be aware that you may find yourself unintentionally molding data to support a predetermined conclusion. Yes, you want your story to spark emotions and encourage action. But analysing the data requires distancing yourself from emotions that may drive unhealthy narrative choices.
Make the context relevant to your audience
Tailor the context of your data story to the situations and concerns your audience cares about. Spend the time to understand your audience, their problems, and their backgrounds. This will help ensure you present a story that resonates with the listener’s point of view. Make your story more substantive by including trends, targets, and performance metrics related to company goals.
Build a strong connection with your audience
A story must be relevant to readers before it can connect with them. Executives are often interested in understanding past performance and identifying future business needs. Ways CLM software helps you uncover relevant contract-related insights include:
- Tracking how much time it takes to close specific types of deals.
- Identifying what causes bottlenecks slow negotiations.
- Comparing contract performance data from year to year to identify areas that need improvement.
Sharing data-driven insights that help executive teams make profitable and effective decisions ensures you build a strong connection with company leaders. They’ll know to come to you for guidance on the issues you discuss.
If you would like to know more about this subject and how Parley Pro can help, please see here: Data Storytelling.

[ Artificial Lawyer is proud to bring you this sponsored thought leadership article by Parley Pro. ]
Discover more from Artificial Lawyer
Subscribe to get the latest posts sent to your email.
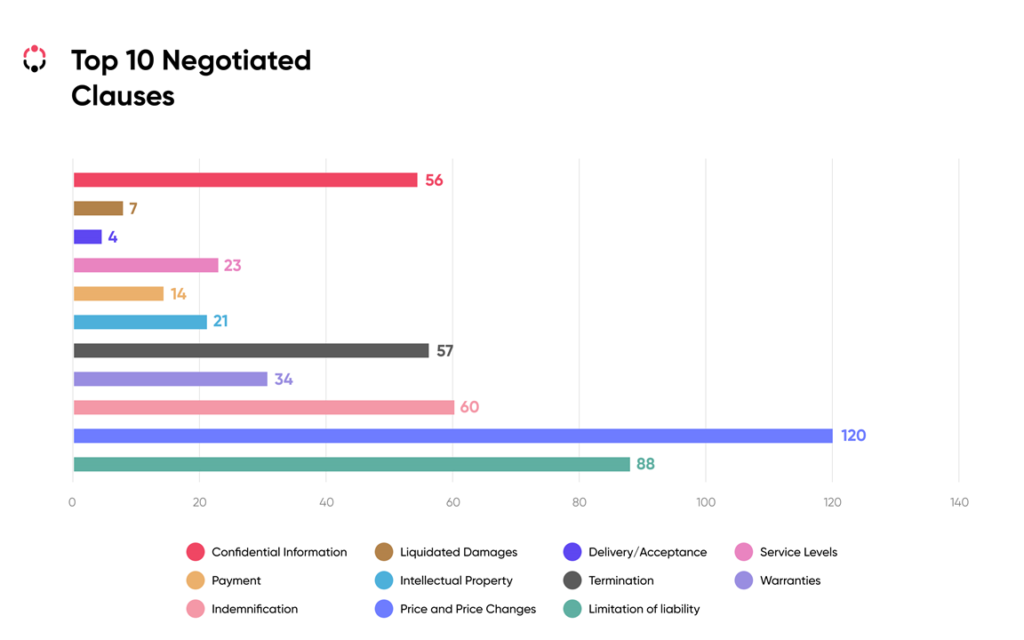
Basic data presentation: In the chart illustrating top 10 negotiated clauses, show the bars in descending order.